Statistics
From the Dashboard click on the Statistics button to access the Statistics page.

The Statistics page is divided in three sections:
- New messages: shows information about the new messages transited through the platform in the selected period.
- Storable messages: shows information about the storable messages transited through the platform in the selected period.
- Flows: shows information about the flows currently present in the platform.
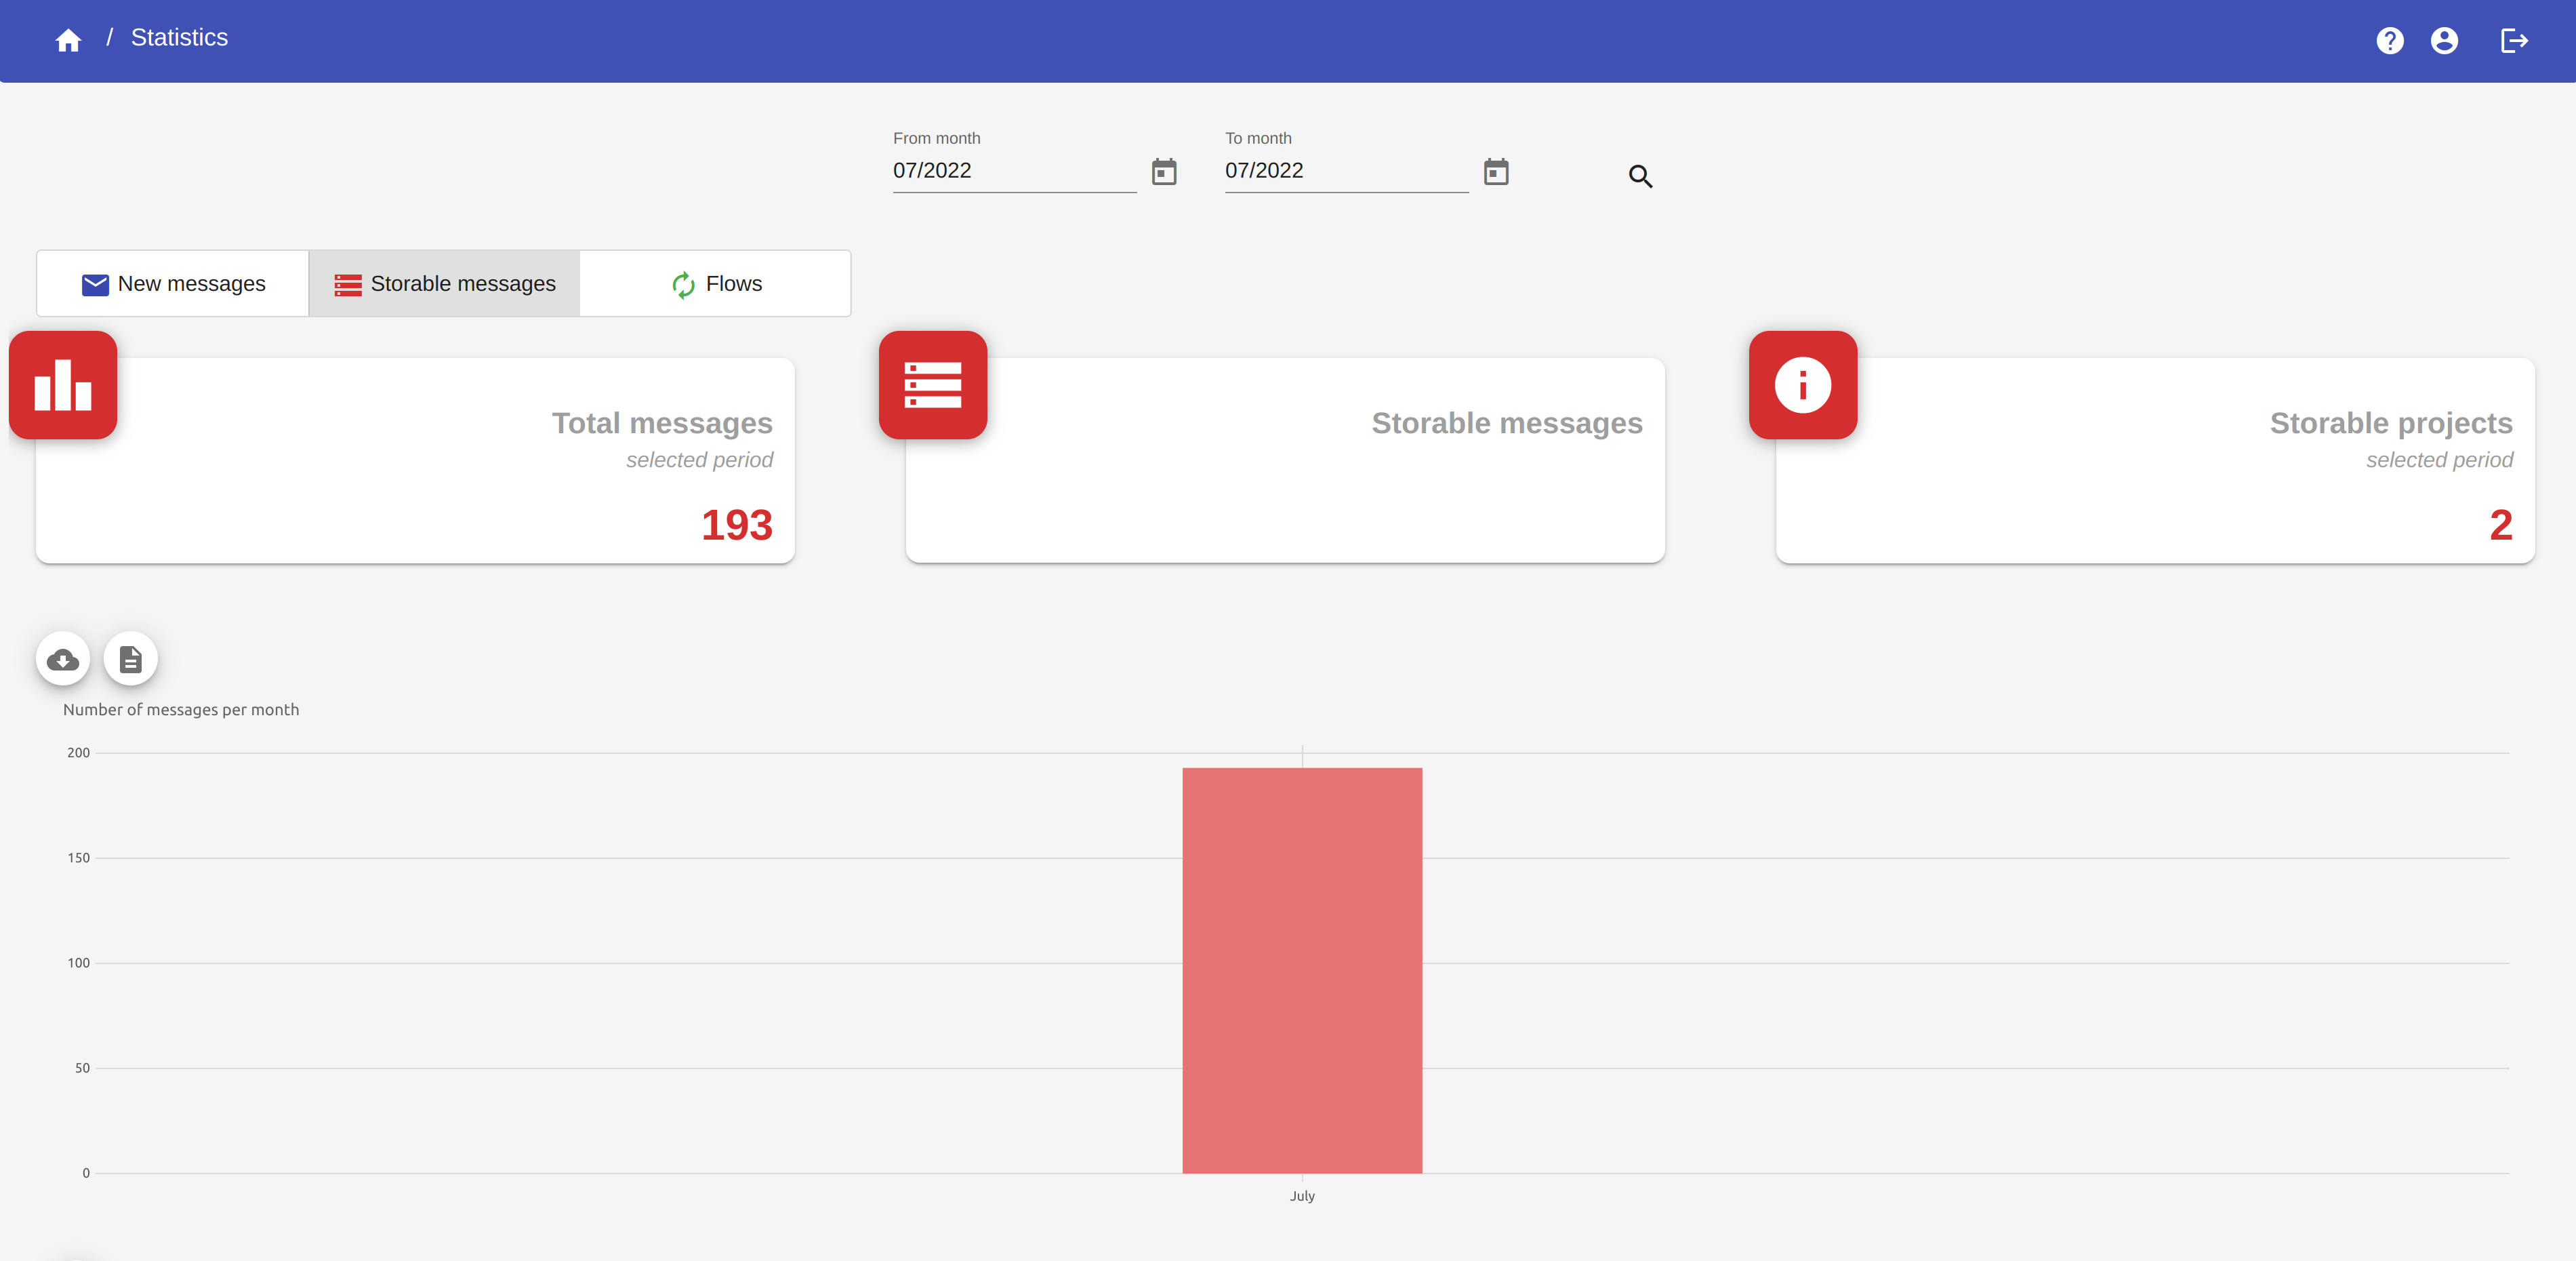
New messages tab
Here you can monitor the trend of the new messages in a selected period.
You can choose the period from the search box at the top of the page.
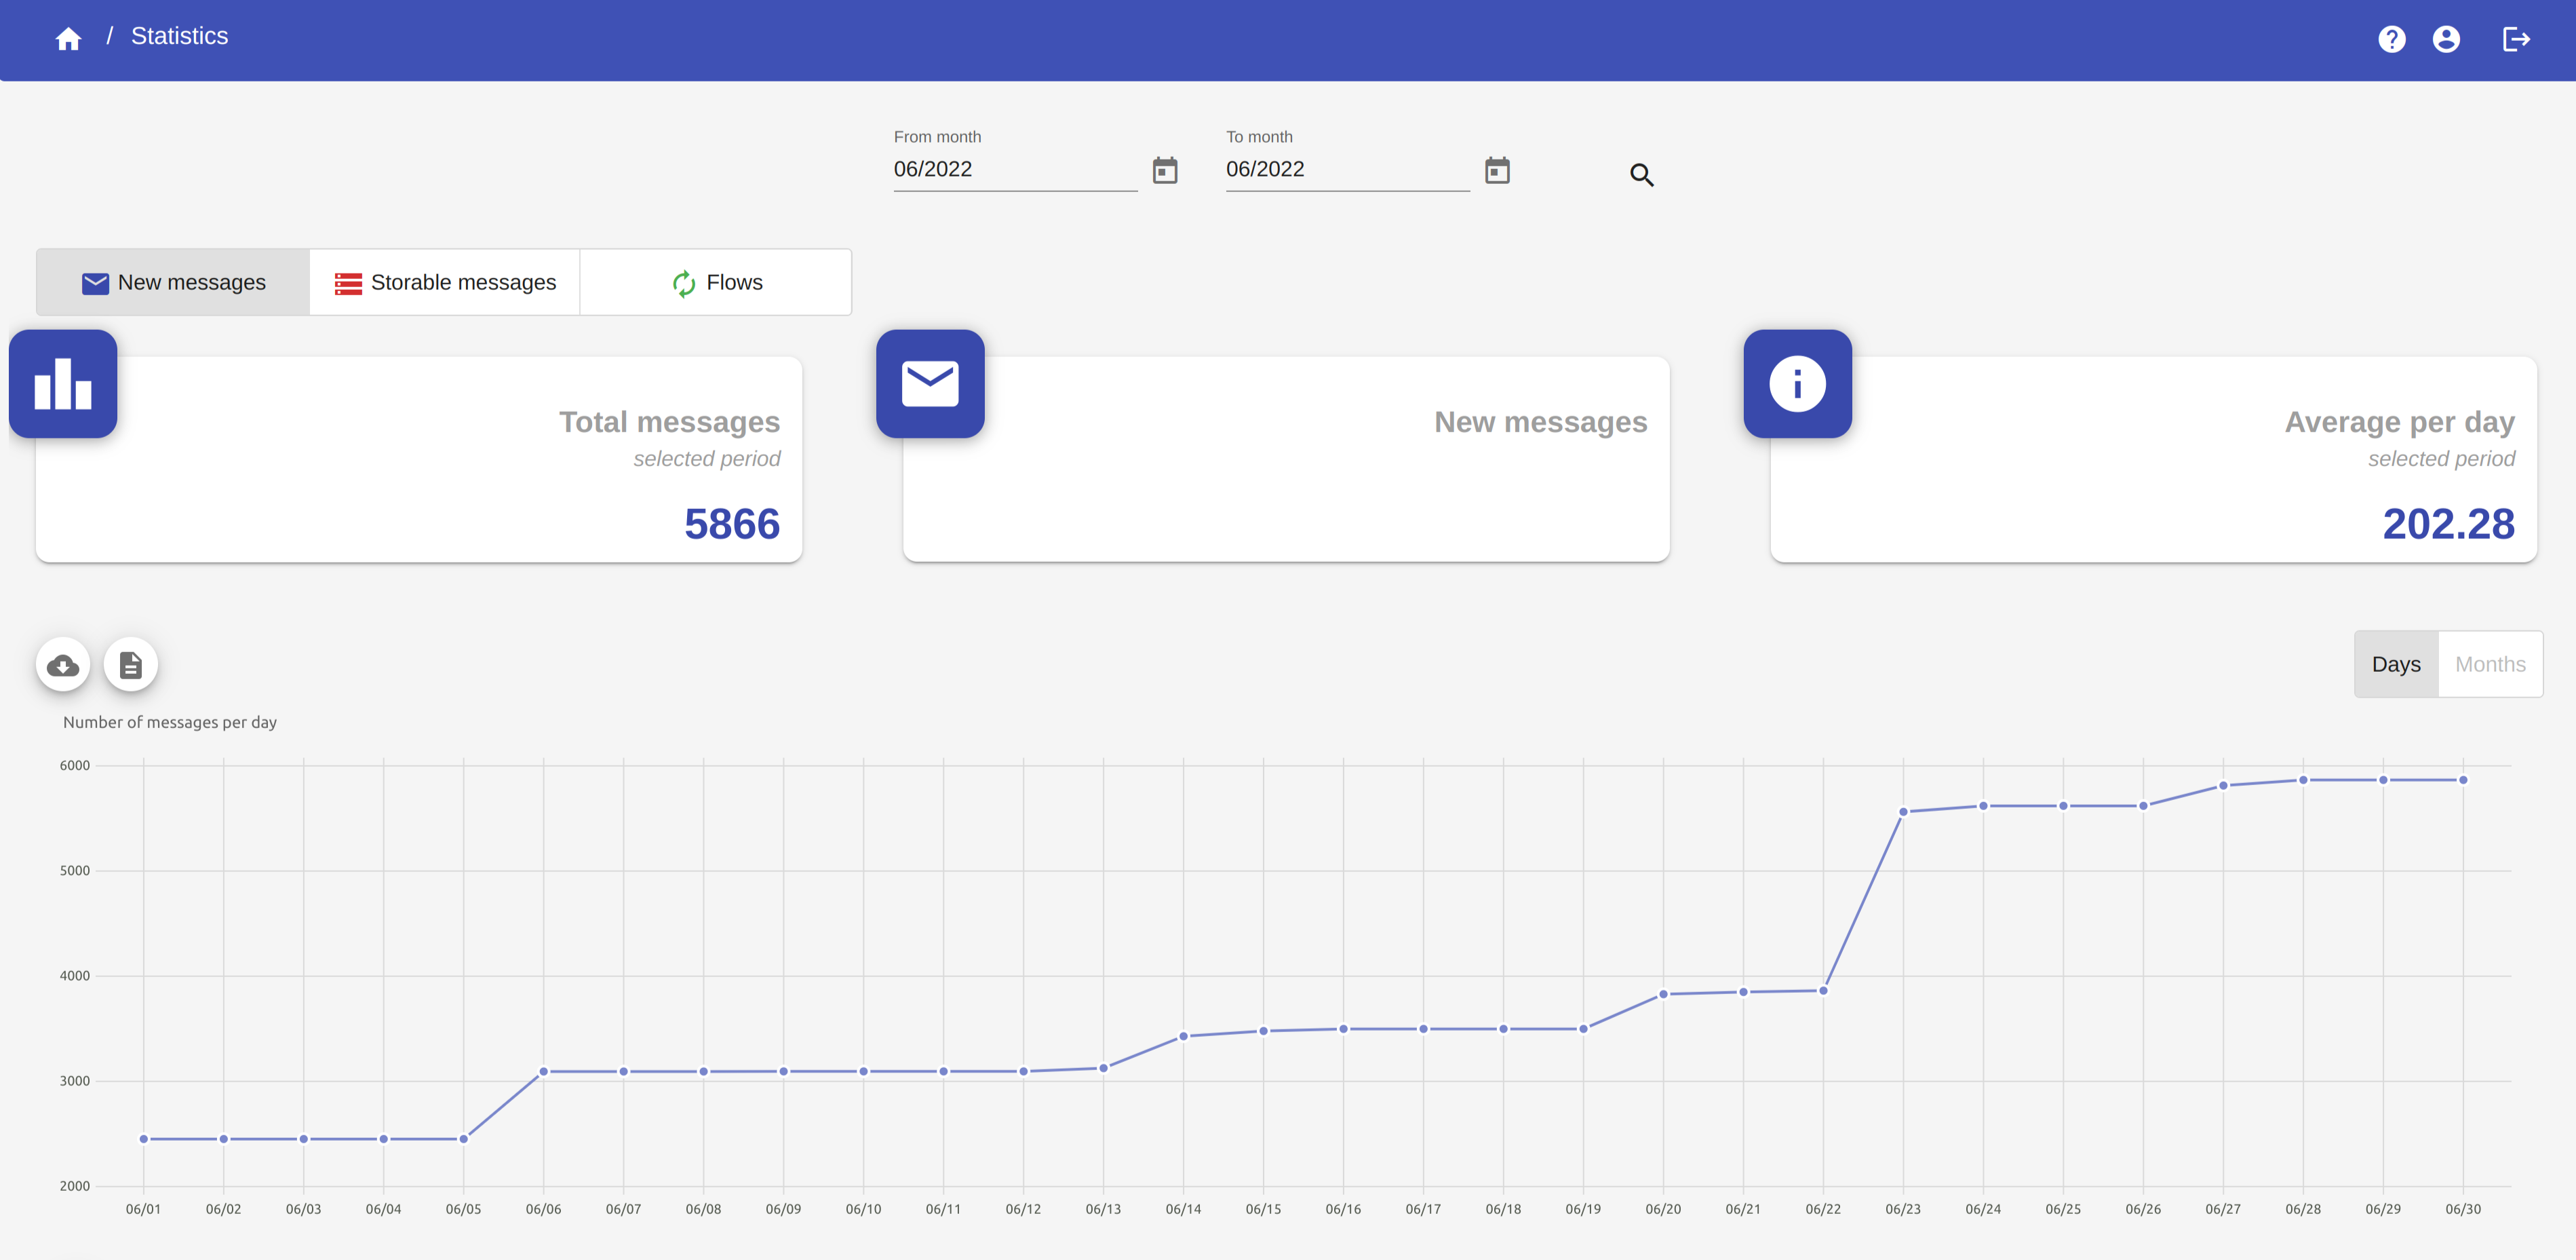
As default, the view is set on "Days", but you can change it to "Months".
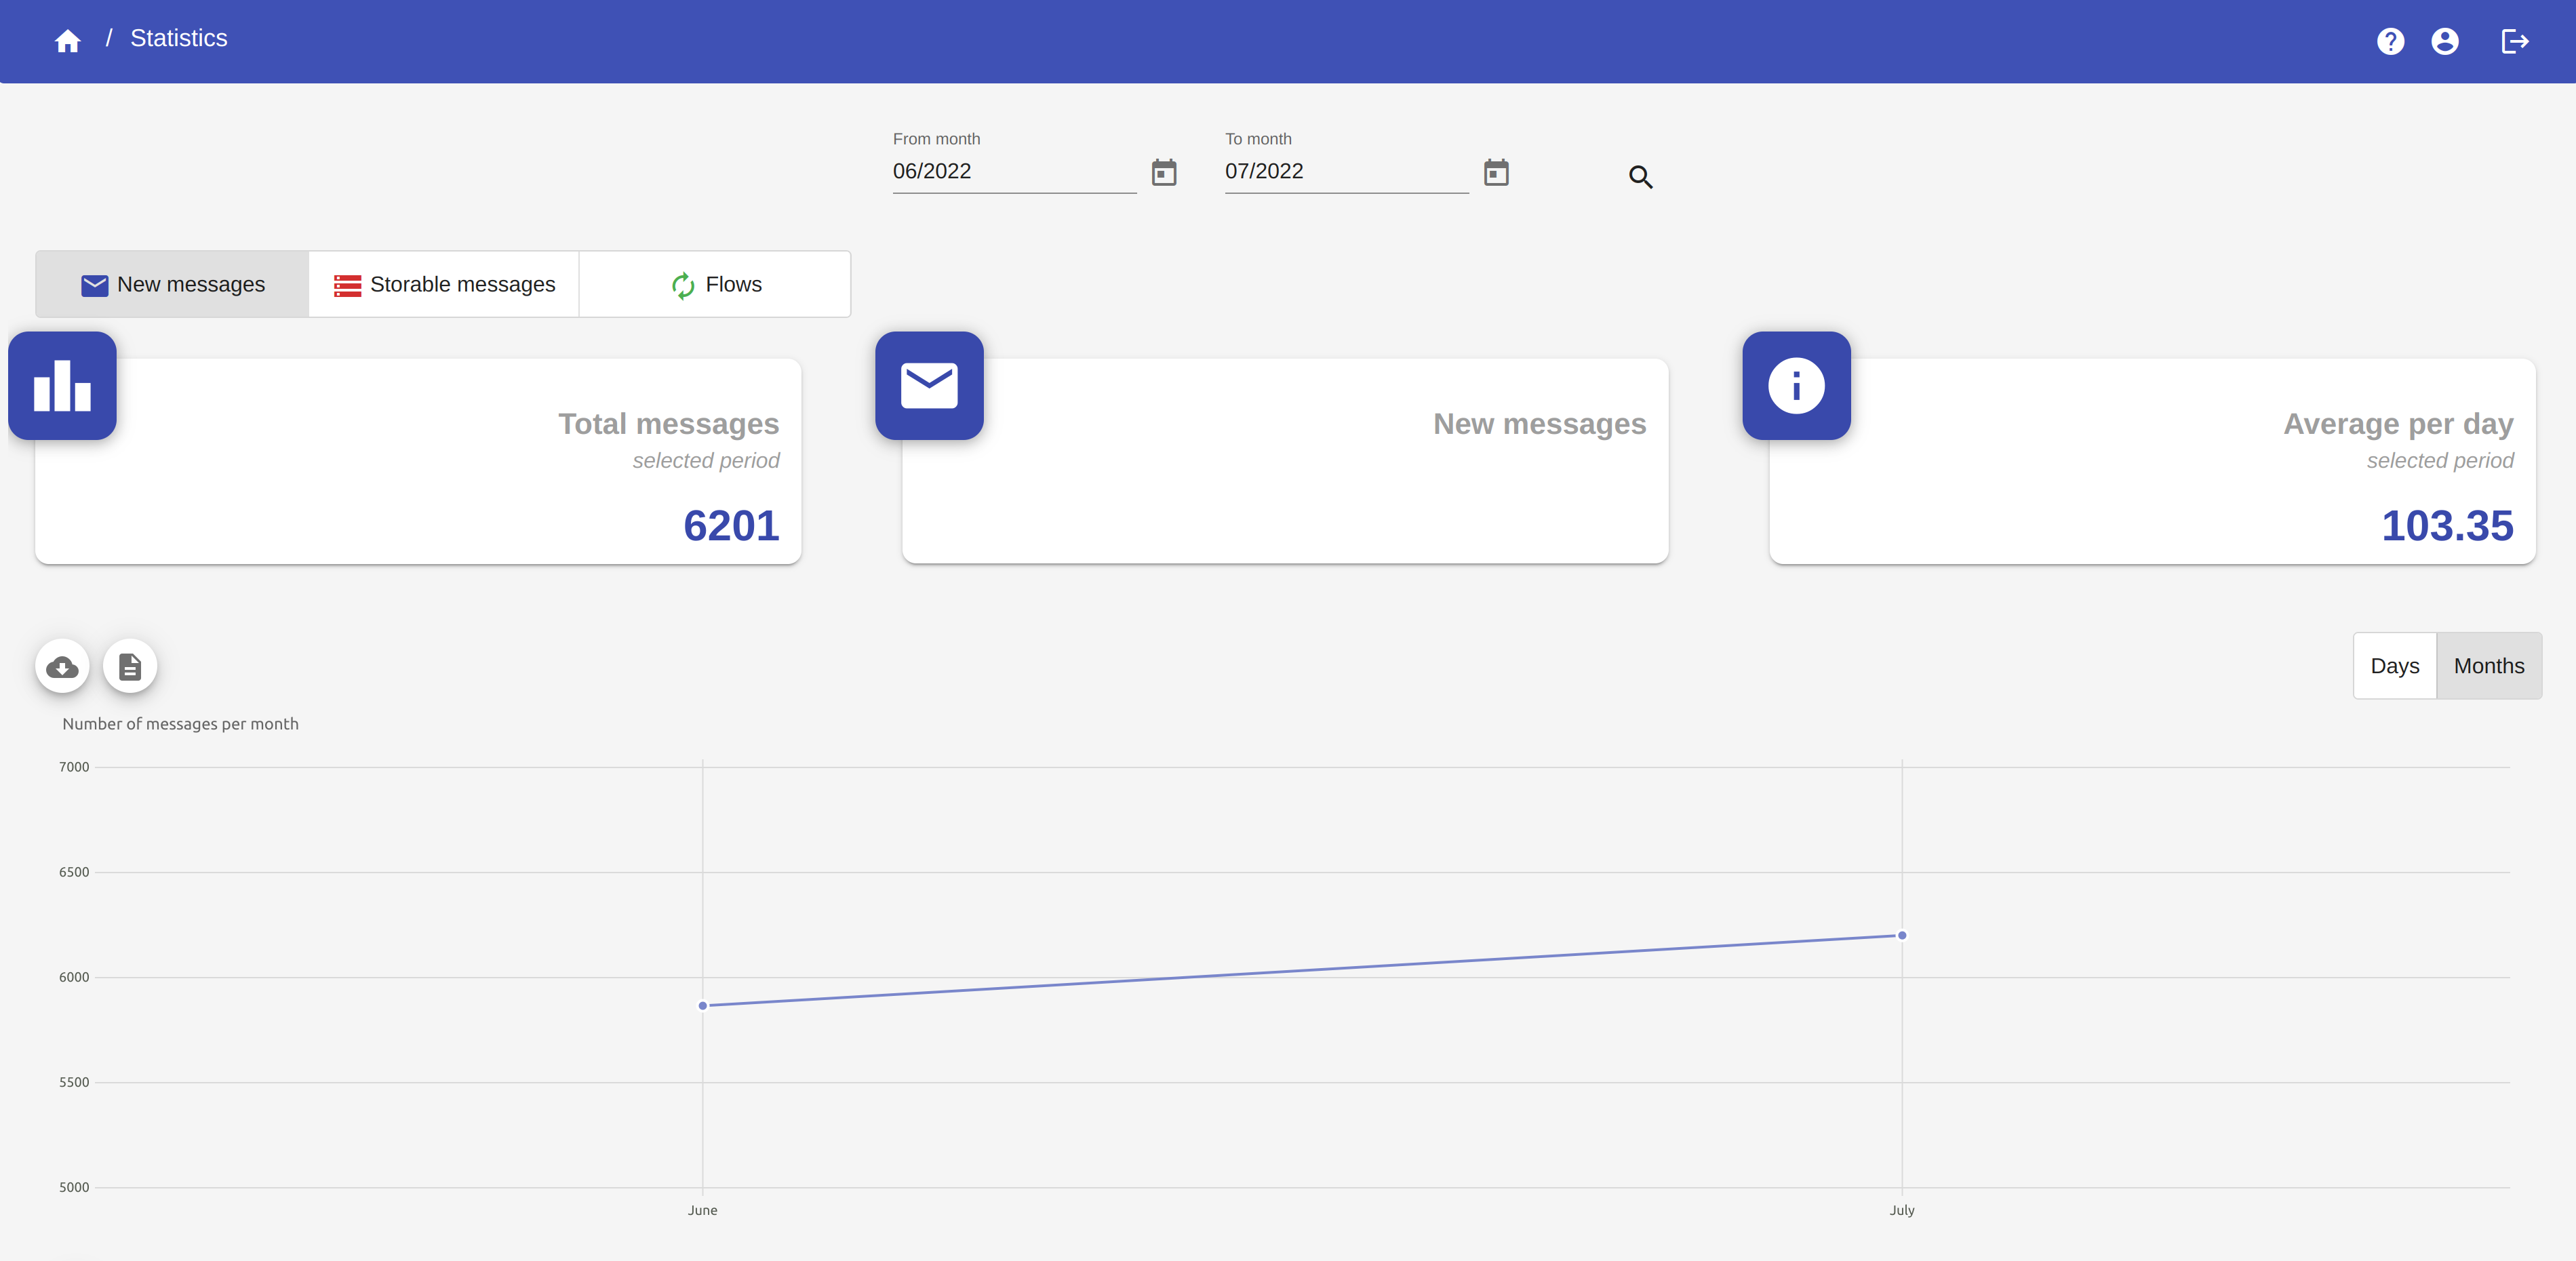
WARNING
The option "Months" is enabled only if the selected period includes more than one month.
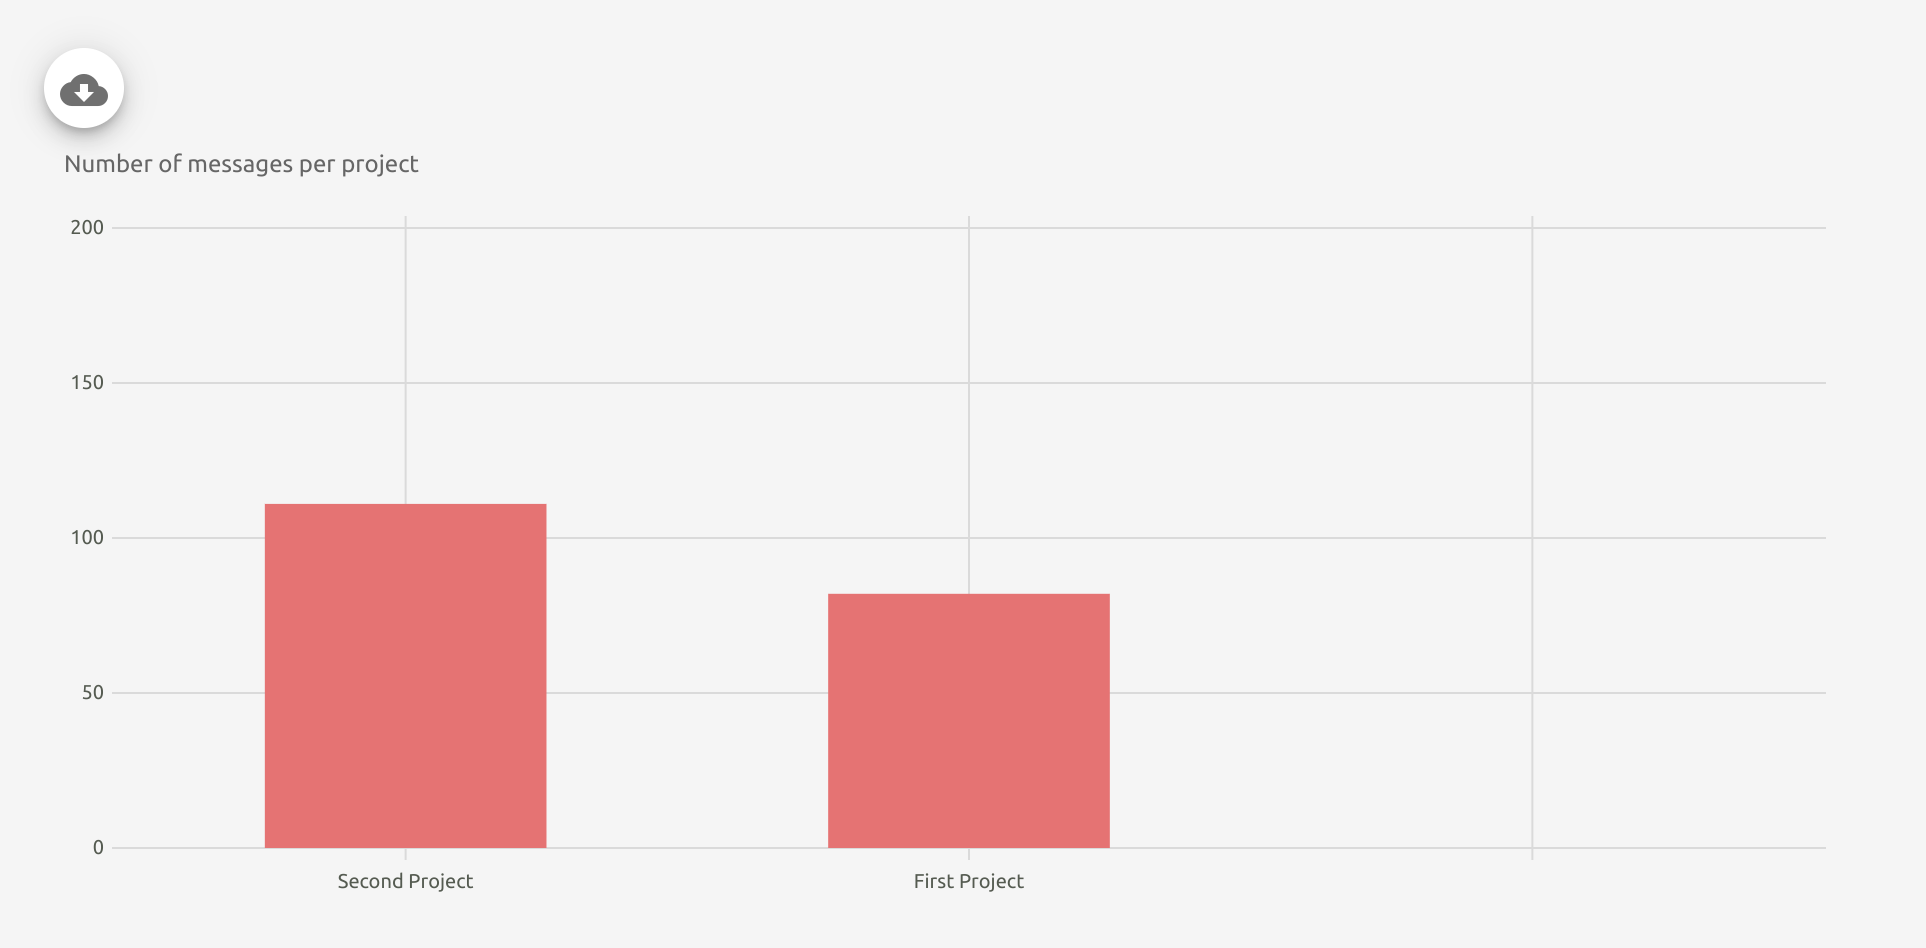
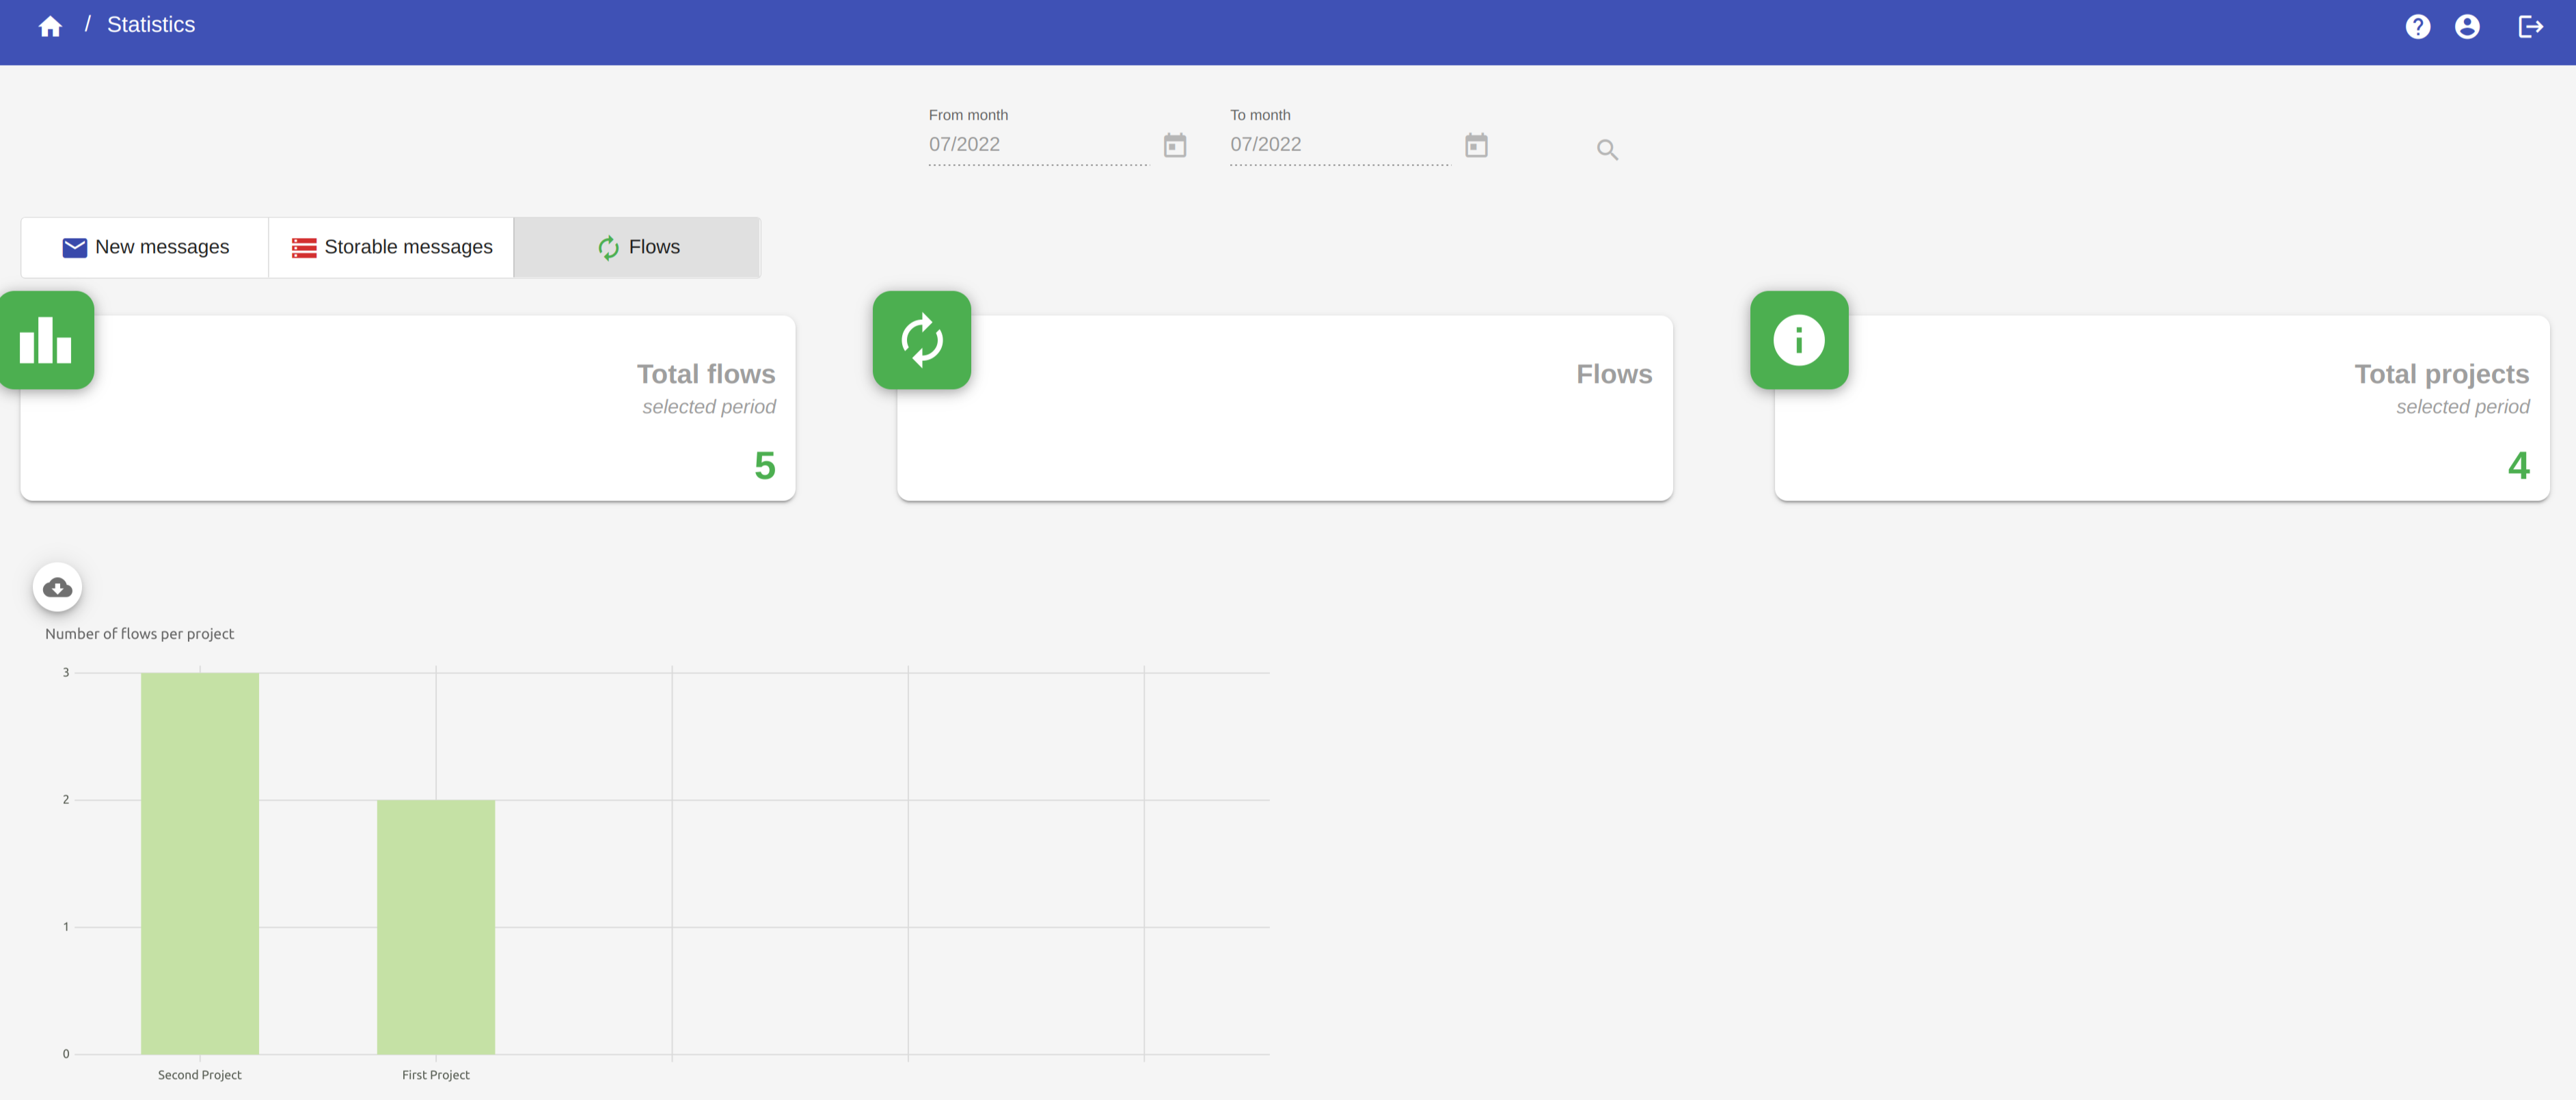
In this chart, you can see the number of messages per project.
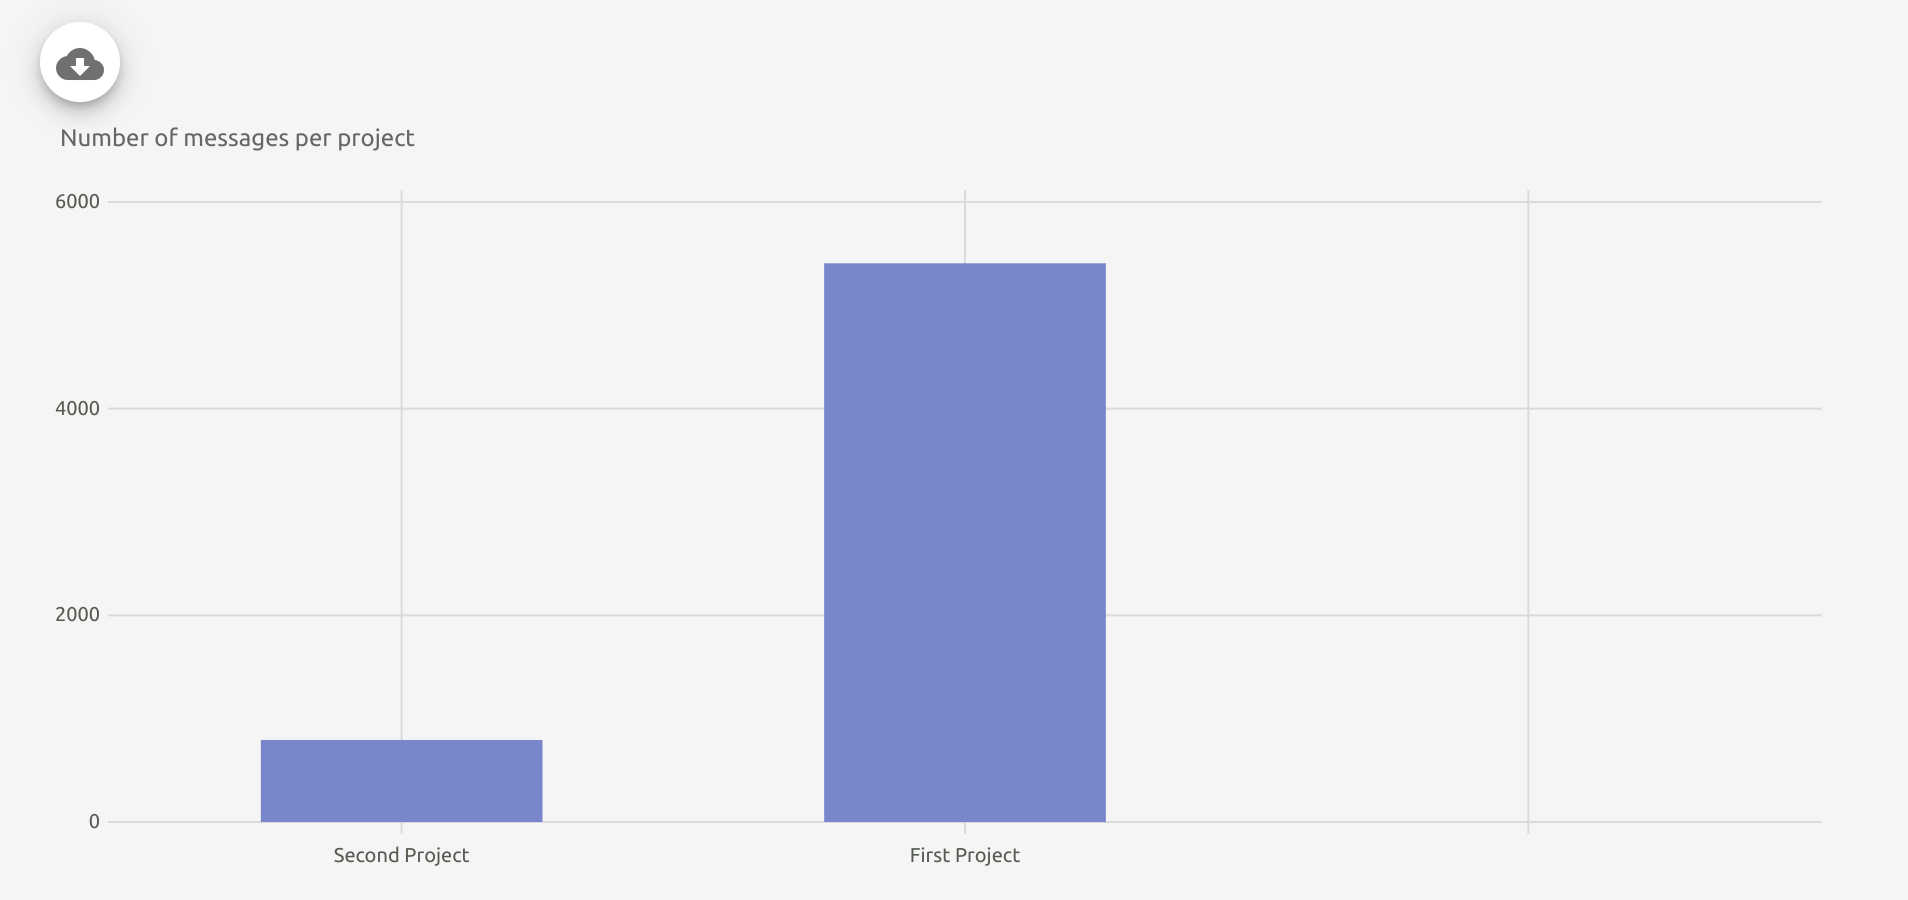
By clicking on the button ![]() you can download the chart.
you can download the chart.
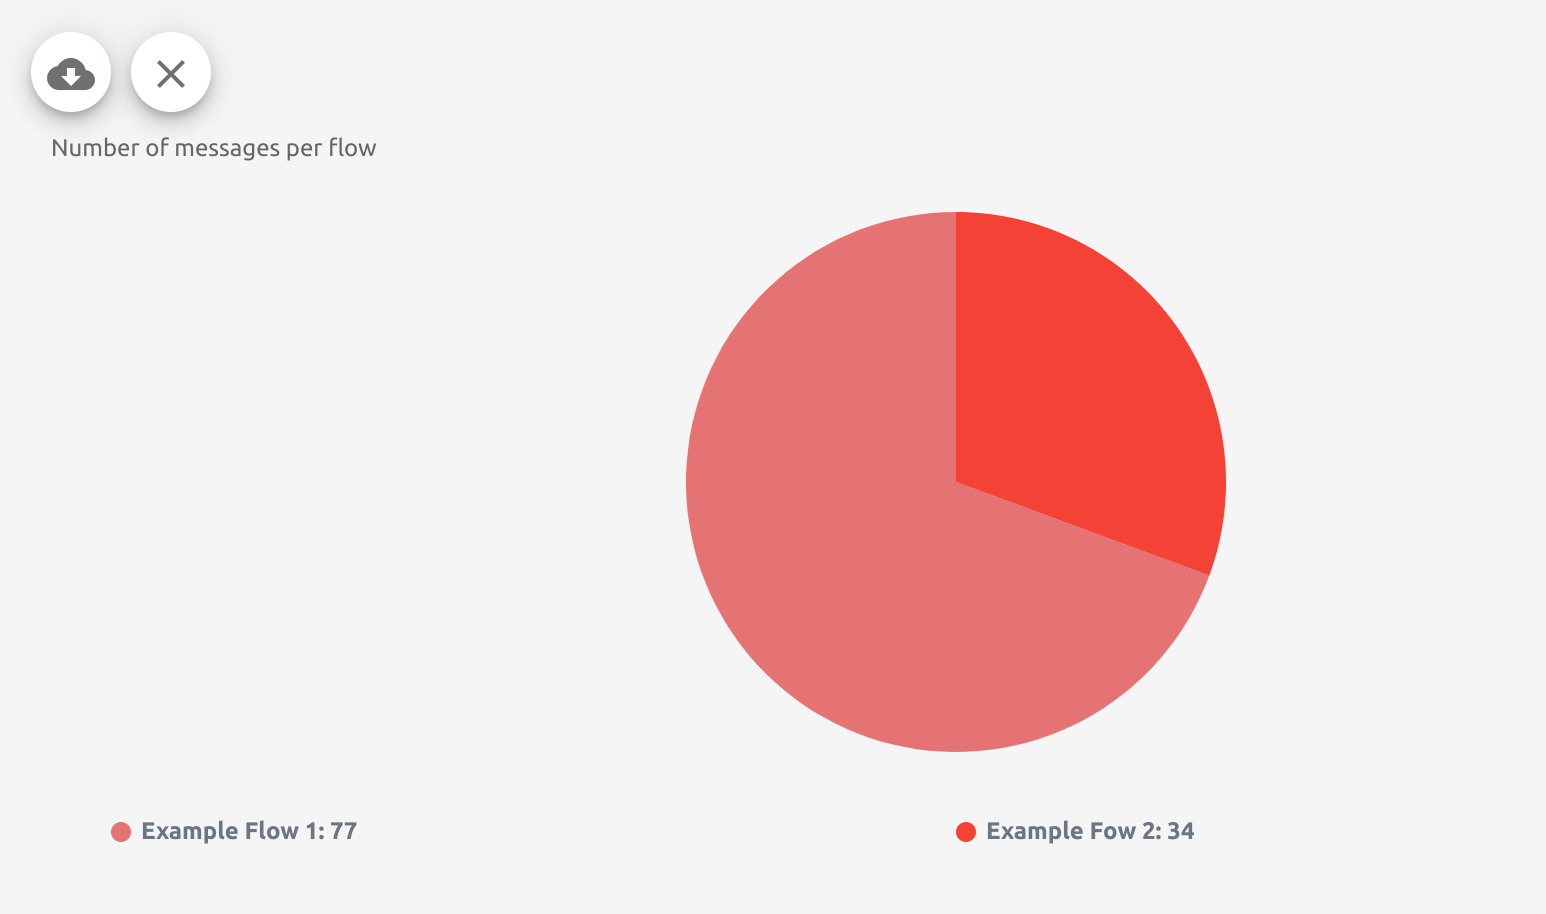
By clicking on one of the chart bars, such as on the bar of the Second project, you can view two more graphs.
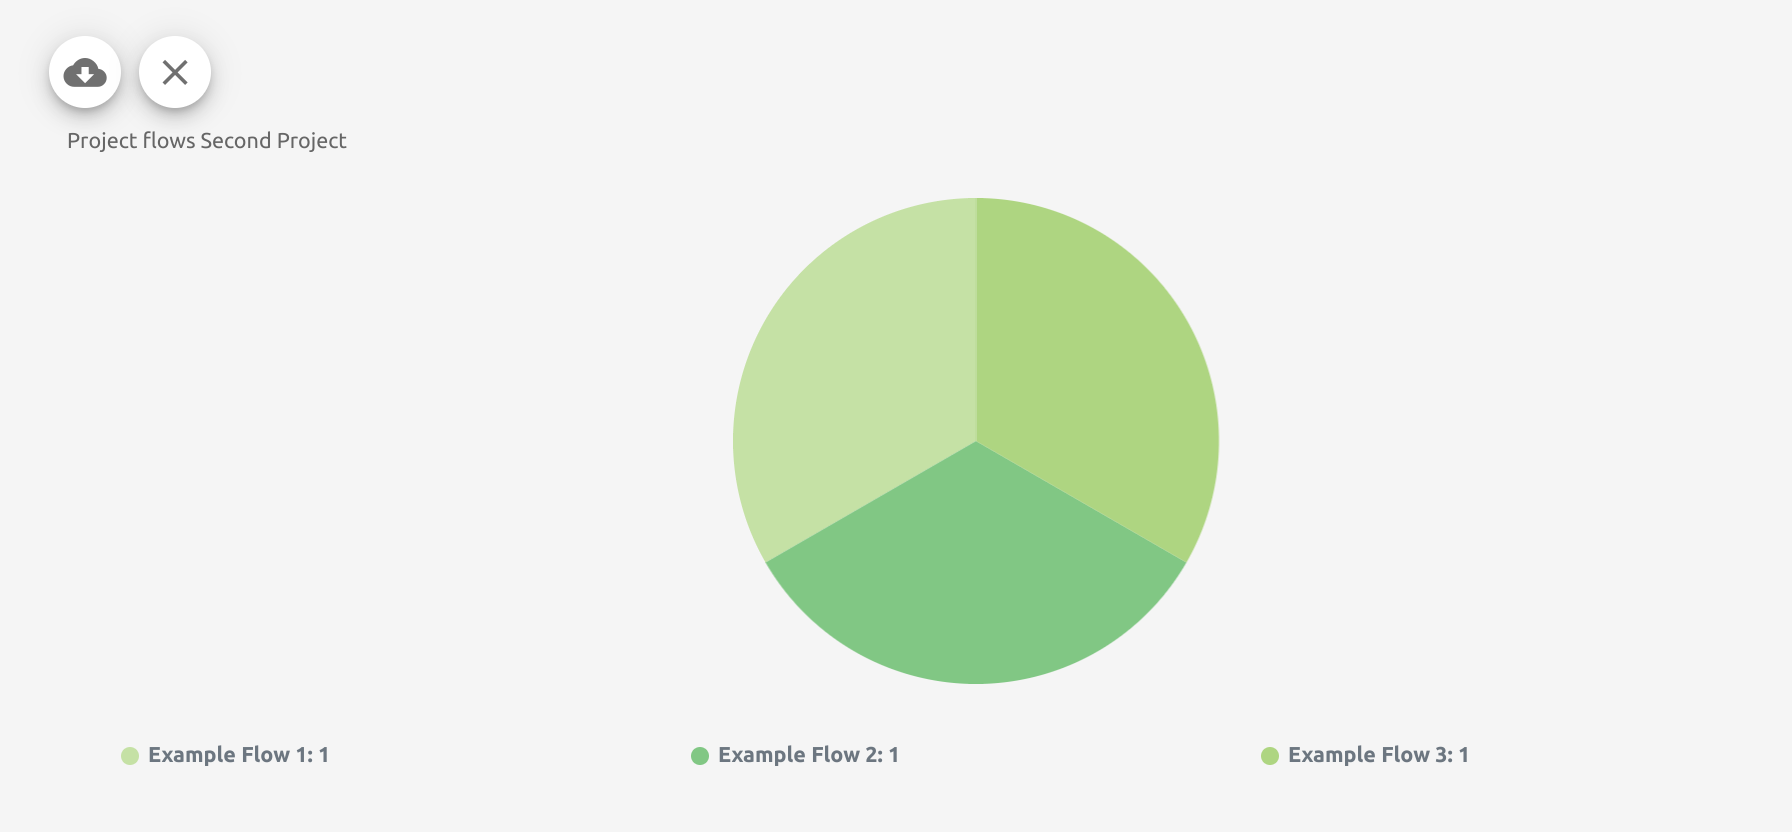
The first one is a pie chart showing the number of messages per flow. In this example, you can see the number of synchronized messages over the selected period for each flow contained in the project Second project.
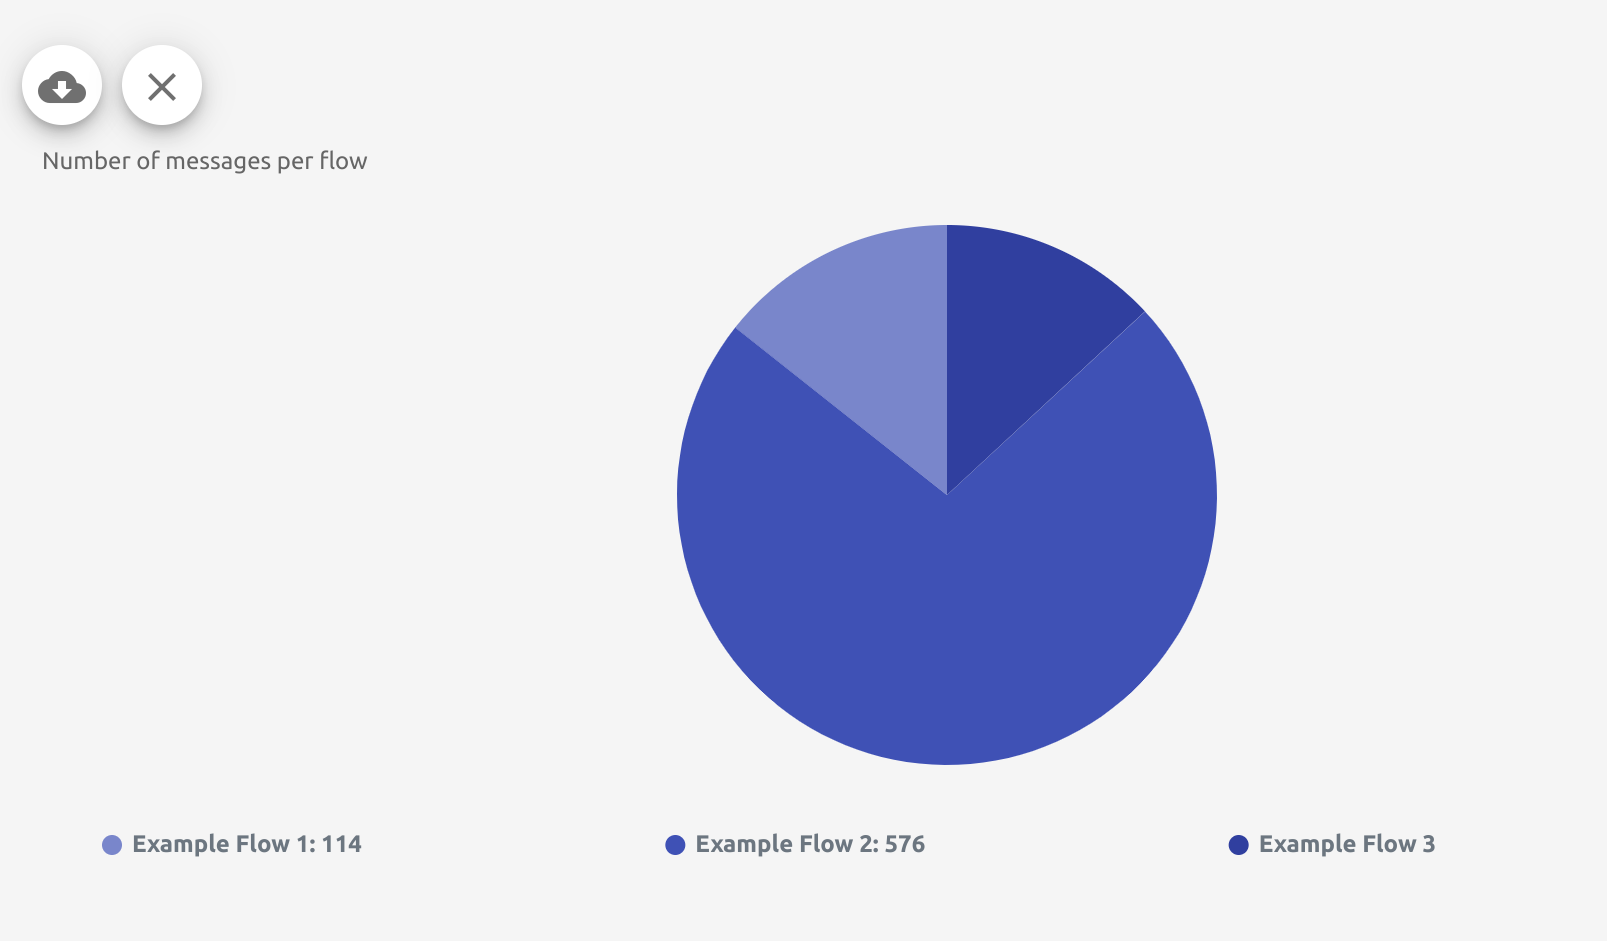
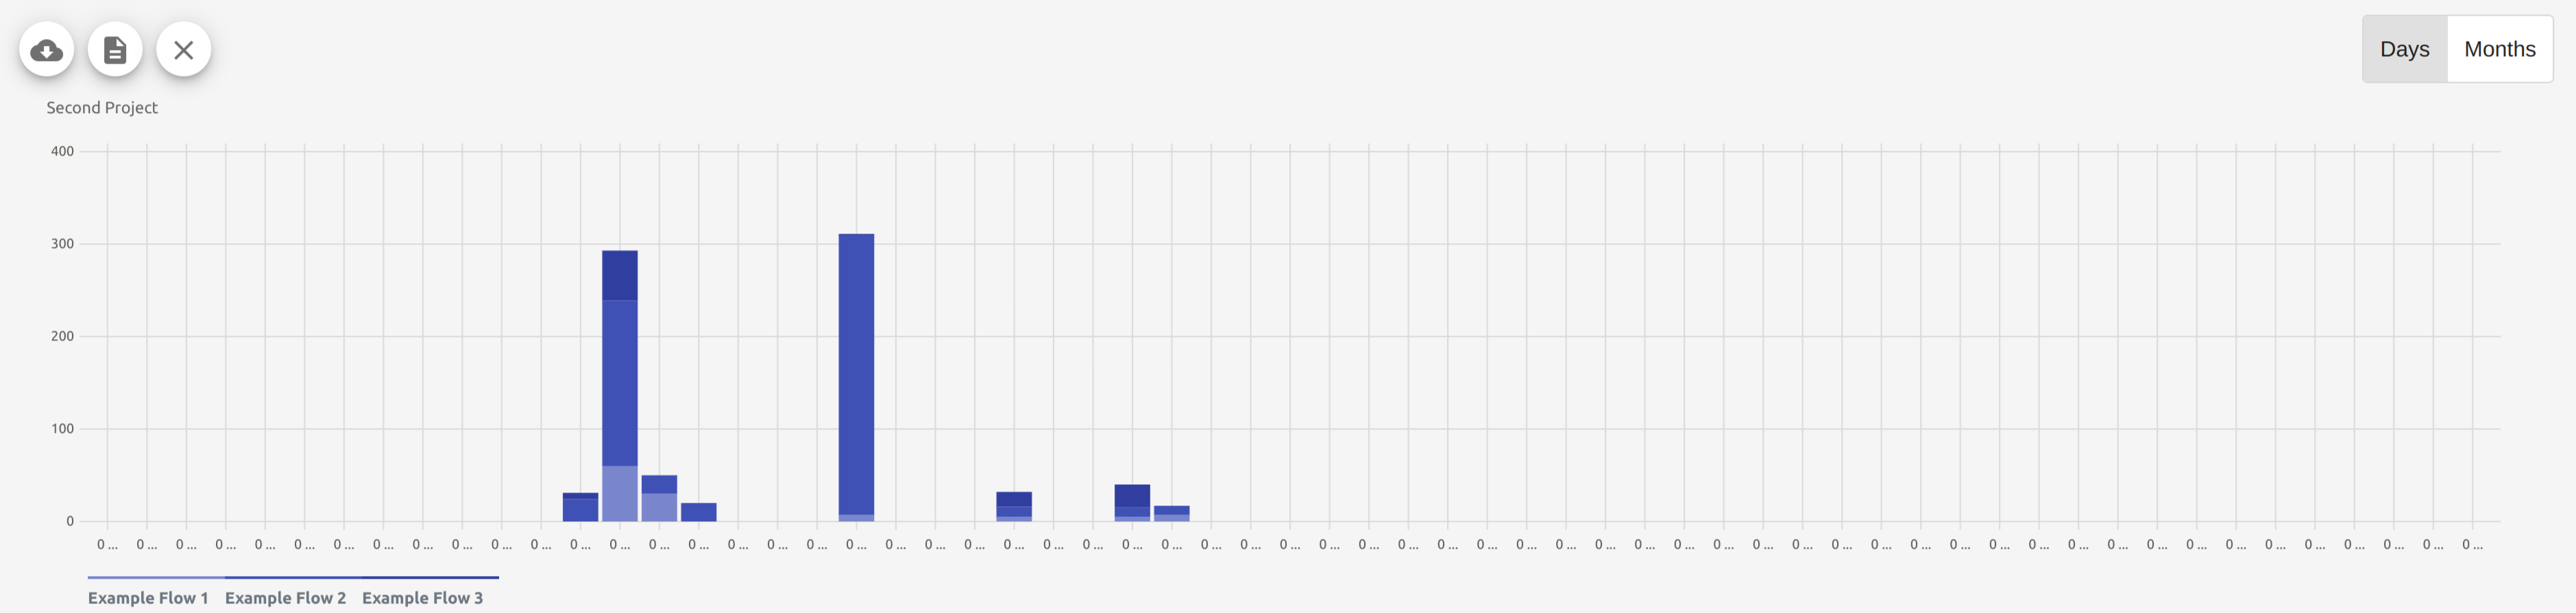
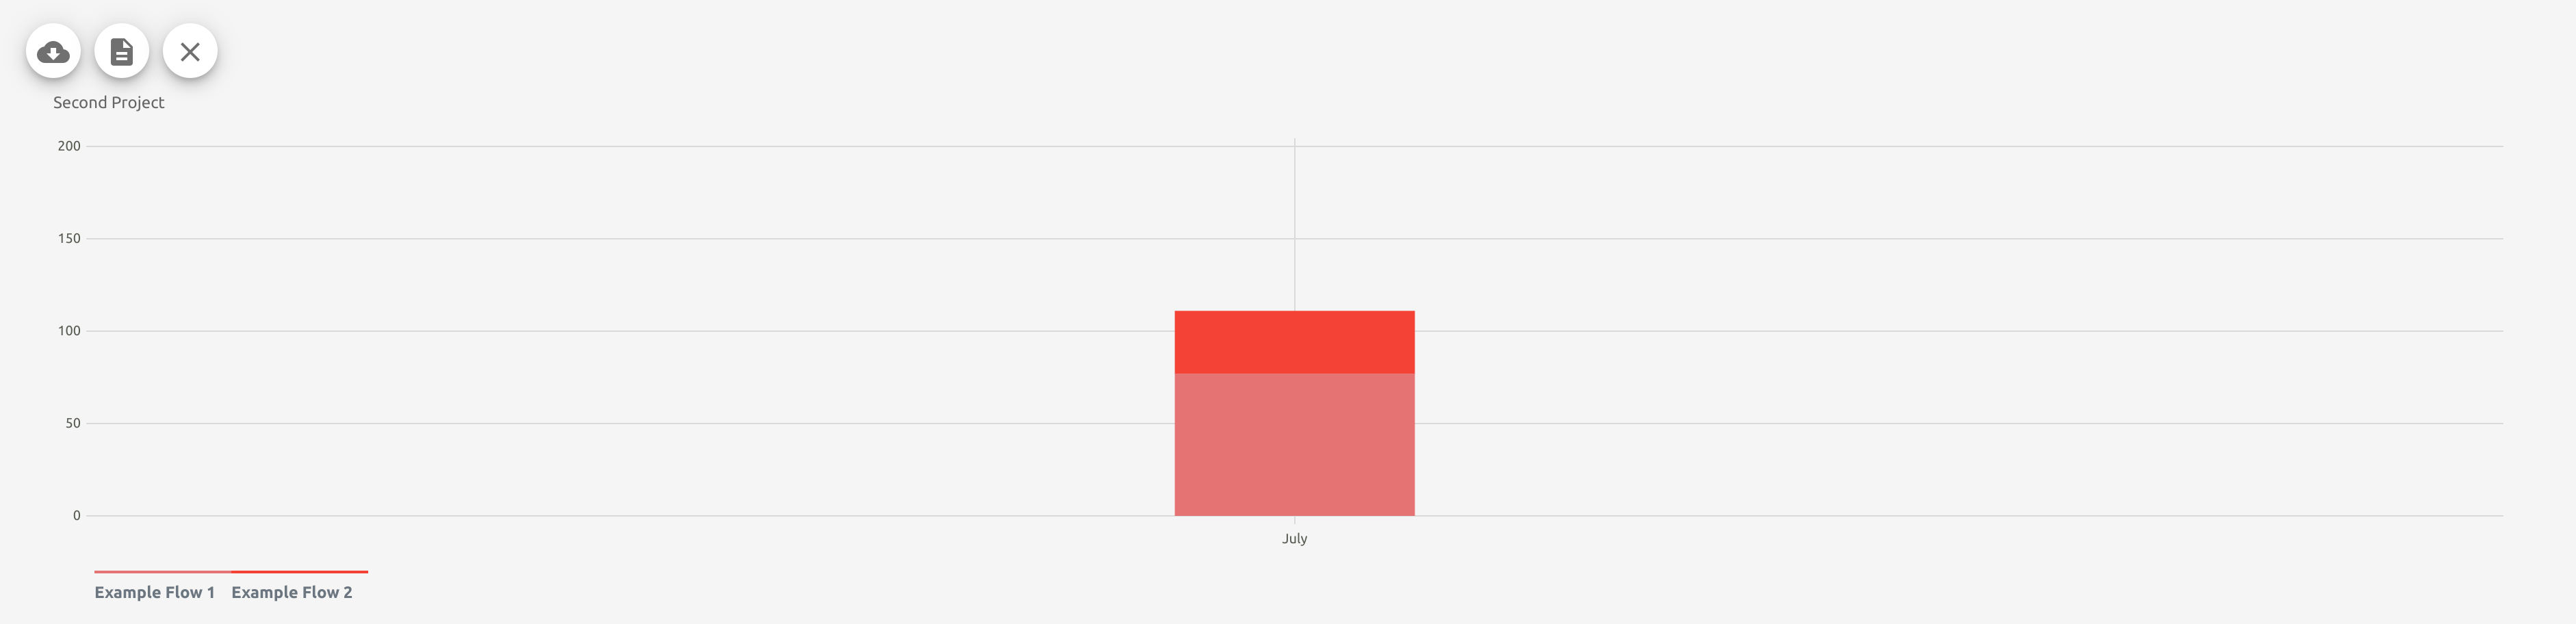
The second one is a bar chart showing the number of messages per flow. You can visualize the messages by days or by months.
By clicking on the button ![]() you can download the chart in excel format.
you can download the chart in excel format.
By clicking on the button ![]() you can close the chart.
you can close the chart.
Storable messages tab
Here you can monitor the trend of the storable messages in a selected period.
You can choose the period from the search box at the top of the page.
In this chart, you can see the number of messages per project.
By clicking on the button ![]() you can download the chart.
you can download the chart.
By clicking on one of the chart bars, such as on the bar of the Second project, you can view two more graphs.
The first one is a pie chart showing the number of messages per flow. In this example, you can see the number of synchronized messages over the selected period for each flow contained in the project Second project.
The second one is a bar chart showing the number of messages per flow.
By clicking on the button ![]() you can download the chart in excel format.
you can download the chart in excel format.
By clicking on the button ![]() you can close the chart.
you can close the chart.
Flows tab
Here you can monitor the flows currently present in the platform.
NOTE
In this tab you cannot select a period to filter data.
NOTE
The flows belonging to a group are counted as one flow.
By clicking on one of the chart bars, such as on the bar of the Second project, you can view one more graph. It is a pie chart showing the number of flow per project.
By clicking on the button ![]() you can download the chart.
you can download the chart.
By clicking on the button ![]() you can close the chart.
you can close the chart.